Tool Demonstration
This page presents the main functionalities of our tool, whose initial screen is presented
next.

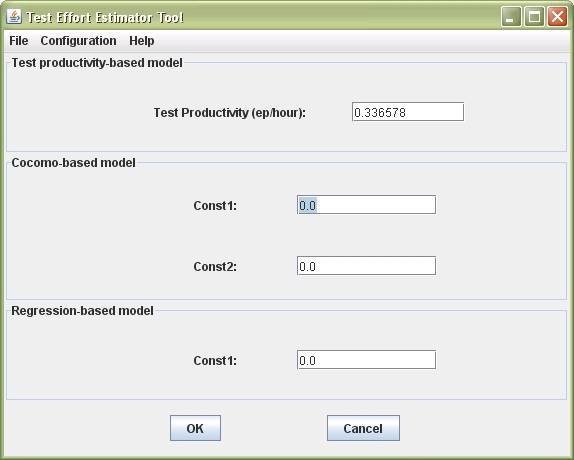
Before estimating test execution
effort, it is necessary that the user configures the tool
with the characteristics that should
be used to measure the size and execution complexity
of test specifications. The
configuration is accessed using the Configuration menu.

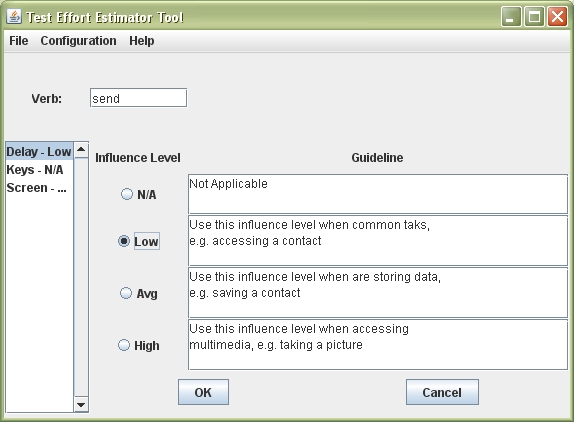
On the mobile application domain,
examples of these characteristics
are the number of screens to
navigate, the number of keys to press and delays in the
application response time. The user
can go back to this step whenever he needs to
reconfigure the model.

The user loads the test cases whose
size and complexity he/she wants to estimate.
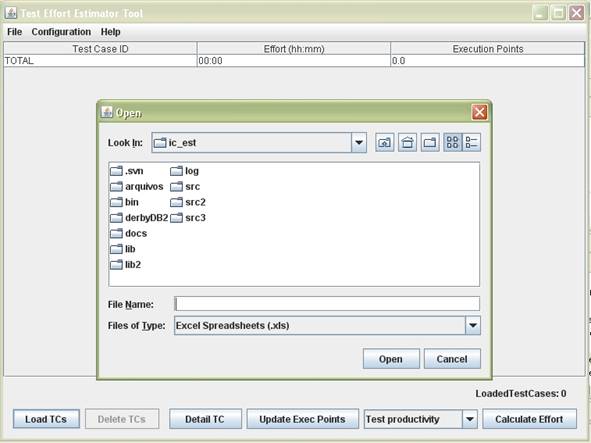
The tool calculates the execution
points of each loaded test case.
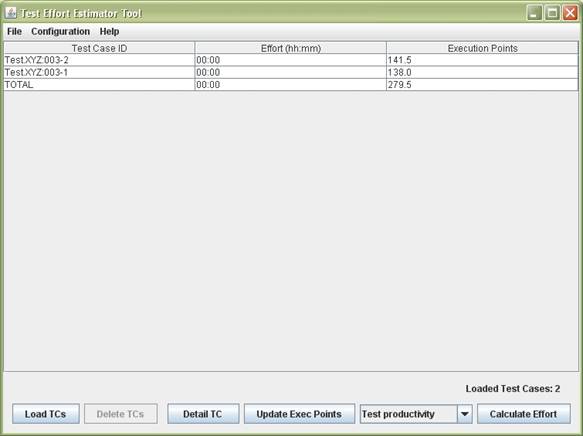
Execution points are computed based
on the test actions identified in the test specifications.
The user can check the details of
each test action evaluated by the tool by clicking on the
“Details” button.
The tool might not recognize some
test actions after processing the test cases. New test actions
are stored in the data base and are
shown to the user with a ‘*’ before the verb.
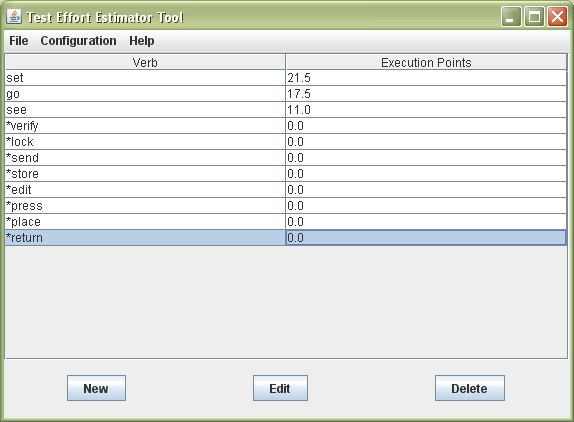
In that case, the user can edit test
actions, by assigning characteristics to them. This is done
by double clicking the verb marked
with ‘*’.
In order to estimate the effort,
based on the execution points that were calculated, the user
needs to configure the productivity
model. Execution points must be mapped to units of time.
After that, the user can estimate the test execution effort
time by clicking the button “Calculate Effort”. The result is
presented in the column ”Effort”.

In addition, our tool provides other
models of estimation, such as Regression Models.