The 1991 Landsat TM band 3 image was registered with the topographic map, with a final spatial resolution of ![]() m. The other images were image-to-image registered, having the 1991 Landsat TM band 3 image as the reference and the same spatial resolution.
The data were resampled using the nearest neighbour technique.
Table 1 presents the RMS registration errors of these Landsat TM images, showing that from this point of view the images are reliably registered.
The possible influence of the registration errors on the forthcoming analysis will be reduced in a erosion procedure as described later.
m. The other images were image-to-image registered, having the 1991 Landsat TM band 3 image as the reference and the same spatial resolution.
The data were resampled using the nearest neighbour technique.
Table 1 presents the RMS registration errors of these Landsat TM images, showing that from this point of view the images are reliably registered.
The possible influence of the registration errors on the forthcoming analysis will be reduced in a erosion procedure as described later.
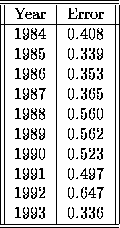
Table 1: RMS REGISTRATION ERRORS OF LANDSAT TM IMAGES
Each Landsat TM image was segmented and then classified into several classes of land cover. The segmentation procedure was a region growing technique, that consists of the aggregation of pixels with similar properties in sets called segments, defined by their borders. The segments classification identifies and labels segments with similar properties using a clustering algorithm called ISOSEG (Erthal et al, 1991), which is a region classifier. This procedure was applied to the ten segmented images already obtained, generating ten thematic images. Four geoclasses were associated to land use and vegetation types: (i) primary forest; (ii) secondary vegetation; (iii) pasture, crops and bare soil; (iv) river; and a nuisance type (v) shadows and clouds.
The 1992 image classification was evaluated by comparing samples from the classified image with samples from a visual interpretation, using 133 samples of different classes. The percentage of agreement was 87%, and the Kappa coefficient of agreement was 76.26 with a variance of 0.0028.
These thematic images were superposed in a GIS system, and using logical (Boolean) operations a regeneration stage classes map was generated.
The classes in this map were defined as areas with recent activities, areas with different stages of secondary vegetation (varying from one to nine years of regeneration), old secondary forest (more than nine years of regeneration), and primary forest. For details about the generation of the regeneration stage map see Sant'Anna et al (1995). Some classes in the map were grouped in order to reduce misclassification errors. The classes used were: ``Recent Activities'', ``(0,2] Years Old'', ``(2,4] Years Old'', ``(4,6] Years Old'', ``(6,8] Years Old'', `` ![]() Years Old'', ``Primary Forest'', ``Without Information''.
These classes correspond, respectively, to areas with bare soil and pasture, regeneration up to 2 years old, regeneration between 2 and 4 years, regeneration between 4 and 6 years, regeneration between 6 and 8 years, regeneration with at least 9 years, primary forest, and areas for which there was no age information due to cloud cover or shadows in the Landsat TM images.
Years Old'', ``Primary Forest'', ``Without Information''.
These classes correspond, respectively, to areas with bare soil and pasture, regeneration up to 2 years old, regeneration between 2 and 4 years, regeneration between 4 and 6 years, regeneration between 6 and 8 years, regeneration with at least 9 years, primary forest, and areas for which there was no age information due to cloud cover or shadows in the Landsat TM images.
Figures 2 and 3 show the color composite of the 1993 Landsat TM image (band 5 (R), band 4 (G), band 3 (B)), and the regeneration stage map, respectively.
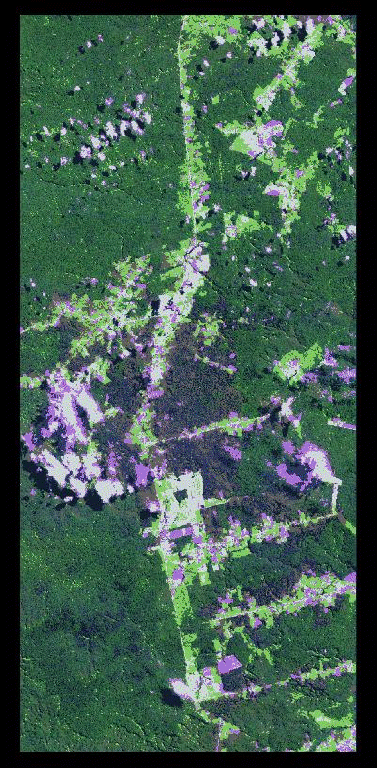
Figure 2: Landsat TM color composite, 1993 (band 5 (R), band 4 (G), band 3 (B)).
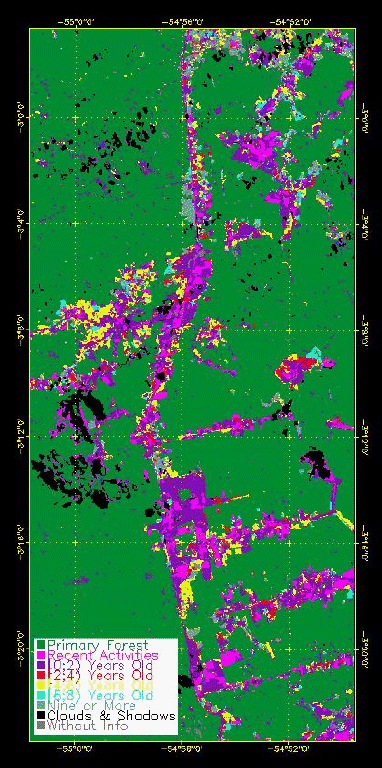
Figure 3: Regeneration stage map.
Each land cover class consisted of isolated, non-connected image regions representing homogeneous areas of each regeneration stage on the ground. These image regions were spatially eroded to reduce the effect of misclassifications at the borders. This was achieved by applying a neighbourhood operation of 5 by 5 pixels which left only those pixels with their 24 neighbours belonging to the same class.
After this operation, the regeneration age map consisted of many isolated image regions, some of which were very small. Image regions of less than 50 pixels in size were subsequently deleted to help reduce the variance of the measurements. The remaining regions were individually labelled so as to allow a comparison between the within-class variation and the inter-class variation and to readily identify regions with surprising responses.
Table 2 shows the number of image regions and the number of pixels of each class before and after the spatial erosion (columns 2 and 3, respectively) and the number of image regions and pixels used for the radar measurements (column 4). It can be seen that many pixels (approximately 33%) were discarded during the erosion procedure, and approximately 2% more were discarded when considering only areas with more than 50 pixels.
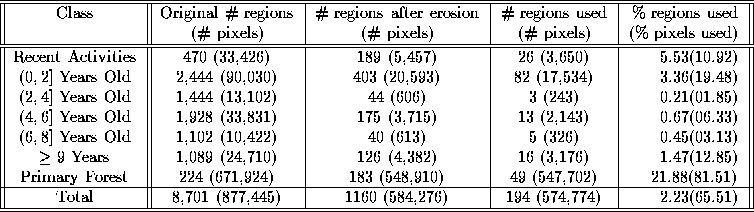
Table 2: SAMPLE SIZES (ORIGINAL, AFTER EROSION AND AFTER REJECTION) IN NUMBERS OF REGIONS AND PIXELS PER REGENERATION STAGE CLASS
When the number of image regions, rather than the number of pixels, are compared it is noticeable that only about 2% of them are used. This is due to the high degree of fragmentation exhibited by most of the classes, where many small image regions (formed by forty-nine pixels at the most) are present. It is important to notice, though, that this 2% of image regions amounts to more than 65% of the available observations and it is expected that these data constitute typical examples of every stage class.
Considering both the percentage of image regions and percentage of pixels used, the class least affected by the erosion/deletion procedure was the ``Primary Forest'' class while the class most affected was the ``(2,4] Years Old'' class.
The regeneration stage map was used as a mask over the SIR-C SAR images. Using this mask, the mean values and coefficients of variation of the radar images were computed for each individual image region remaining after the erosion and deletion process.
Figure 4 (a) to (d) shows the SIR-C SAR images, L and C bands and both polarizations. The color composite of the SIR-C data (L-HH (R), L-HV (G), C-HH (B)) is shown in Figure 5.
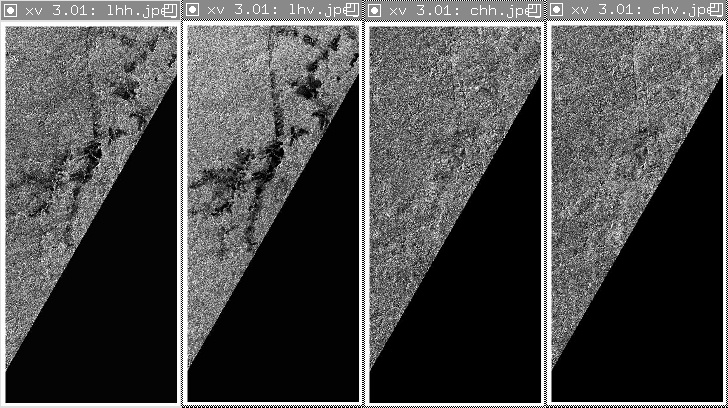
Figure 4: SIR-C SAR images (a) L-HH, (b) L-HV, (d) C-HH and (d) C-VV bands and polarizations.
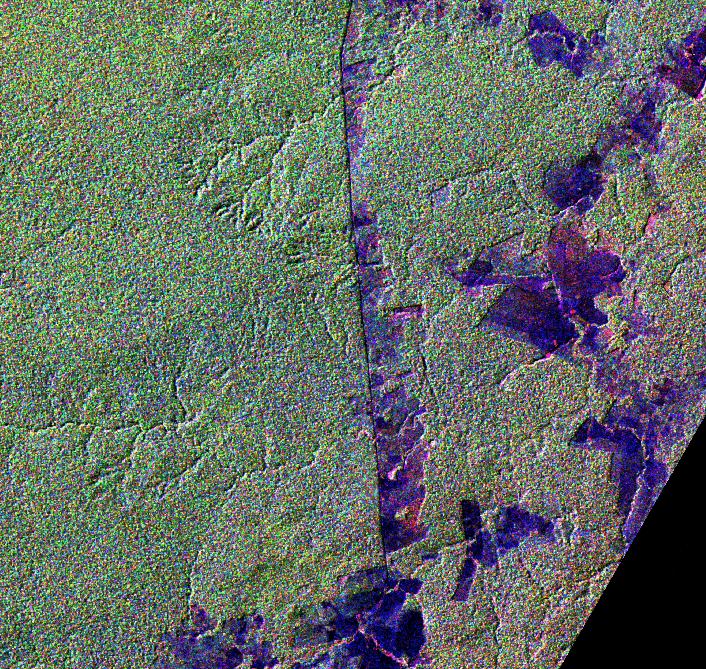
Figure 5: Color composite of SIR-C SAR data (L-HH (R), L-HV (G), C-HH (B)).
The dimensions of the regeneration map is ![]() pixels. The area of this map covered by the SIR-C SAR images contains 935,128 pixels, from which 877,445 pixels belong to the seven regeneration stage classes; the remaining pixels belong to the ``Without Information'' class. The forthcoming analysis refers only to the area covered by the SIR-C SAR images.
pixels. The area of this map covered by the SIR-C SAR images contains 935,128 pixels, from which 877,445 pixels belong to the seven regeneration stage classes; the remaining pixels belong to the ``Without Information'' class. The forthcoming analysis refers only to the area covered by the SIR-C SAR images.
It should be noted that the regeneration stage map reflects the stages of the second-growth succession in 1993, while the radar data used is from 1994. Unfortunately, no cloud free Landsat TM image was available from the test site in 1994 for updating the regeneration stage map. Therefore, it is possible that some of the areas might have changed between these dates. This may be a source of error for measurements from individual image regions.