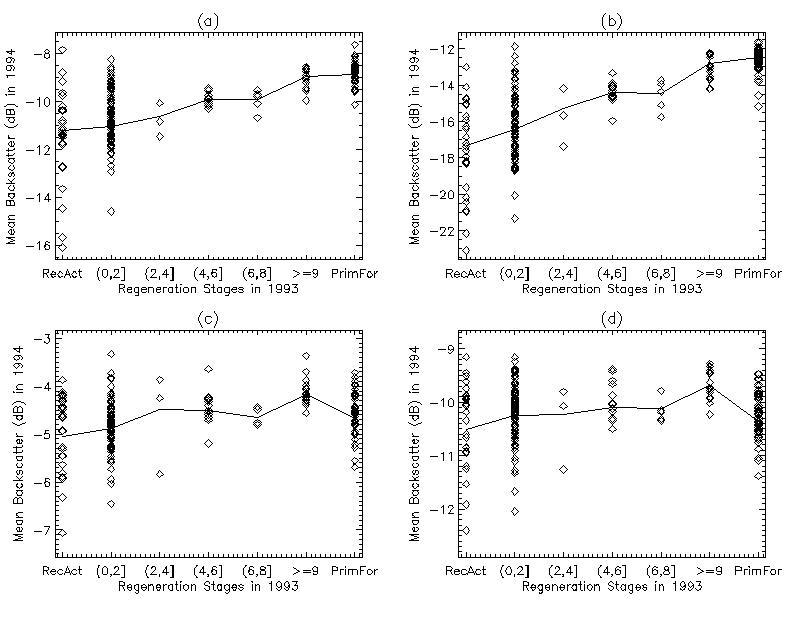
Figure 6 (a) to (d) shows the individual means for each image region of each class (diamonds). The lines join the mean of each class taken as a whole (global means). The large variation of the mean over individual image regions is apparent in any band and polarization. This variation appears to be larger in areas of recent activities (classes denoted as ``RecAct'') and in areas of up to 2 years of regeneration (denoted as ``(0,2]'') in all bands and polarizations.

Figure 6: Tonal means per class (solid line) and per individual image regions ( ![]() ): (a) L-HH, (b) L-HV, (c) C-HH and (d) C-HV bands.
): (a) L-HH, (b) L-HV, (c) C-HH and (d) C-HV bands.
There are several reasons for this large variation. Due to microtopography in the region pixels on the slopes facing the radar viewing direction have higher backscatter than those on opposite slopes, causing changes in the return of all channels, especially in areas with sparse vegetation cover. Also, some areas are promptly cleared for cattle ranching, others are used for shifting cultivation, some have trunks standing or laying down. Another reason for this large variation might be probable misclassifications in the age map and the differences in acquisition date for the most recent Landsat TM image and the SIR-C SAR data. For instance, the classes most affected by the difference in acquisition date will be the ``RecAct'' and ``(0,2]'' classes because these have had the largest disturbance during this period. Also, these are the classes most likely to be associated with man-made features which may affect the backscattering coefficients measured (e.g. roads, houses, etc.). These variations altogether might be the cause of a wide range of scattering properties, mainly for recently disturbed areas.
The image regions associated with primary forest show means with less variation in L-band than in C-band (both polarizations), and this variation is always smaller than the one observed for ``RecAct'' and ``(0,2]'' classes.
Analyzing the global means per classes (solid lines), it is noticeable that L-band shows an almost always increasing relationship with regeneration stage. The same is not so evident in C-band, where in both polarizations there is a decrease of the return for mature forest areas. For the available data at L-band (both polarizations) a saturation appears between the ``(4,6]'' and ``(6,8]'' classes, though after the latter there is a noticeable increase towards the remaining two classes. In particular, there is no visible saturation between ``(6,8]'' and `` ![]() '' classes.
'' classes.
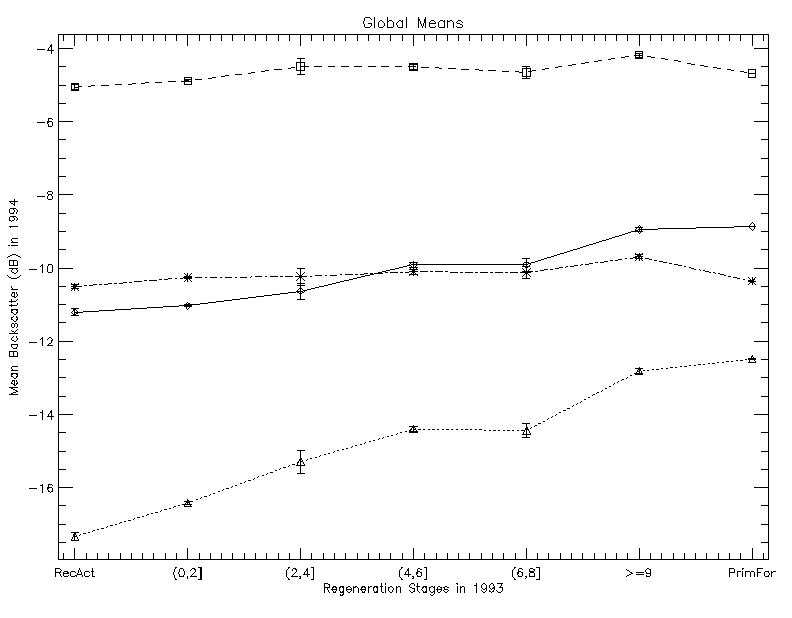
Figure 7 shows the global means of the four combinations of wavelength and polarization, with the ![]() confidence intervals for the true means.
Comparing the return of C and L bands it is clear that, using the mean values,
L-HV has, in general, the best discriminatory properties for regenerating
areas, among the considered data sets.
Only the means for the ``(4,6]'' and ``(6,8]'' classes are not statistically different at the considered significance level.
Note that for the L-HV band and polarization the means differences for consecutive classes are of about 1 dB, except for ``(4,6]'' and ``(6,8]'', and for ``
confidence intervals for the true means.
Comparing the return of C and L bands it is clear that, using the mean values,
L-HV has, in general, the best discriminatory properties for regenerating
areas, among the considered data sets.
Only the means for the ``(4,6]'' and ``(6,8]'' classes are not statistically different at the considered significance level.
Note that for the L-HV band and polarization the means differences for consecutive classes are of about 1 dB, except for ``(4,6]'' and ``(6,8]'', and for `` ![]() '' and ``PrimFor'' classes.
The differences between the class means are smaller in L-HH than in L-HV.
The smaller dynamic range of C-band regeneration stage means in both polarizations shows that this wavelength is less suitable for the assessment of forest regeneration stage, except for the discrimination between primary forest and old regeneration areas (``
'' and ``PrimFor'' classes.
The differences between the class means are smaller in L-HH than in L-HV.
The smaller dynamic range of C-band regeneration stage means in both polarizations shows that this wavelength is less suitable for the assessment of forest regeneration stage, except for the discrimination between primary forest and old regeneration areas (`` ![]() '').
'').

Figure 7: Tonal means and 95% confidence intervals considering classes as a whole: L-HH in solid line (--), L-HV in dotted line ( ![]() ), C-HH in dashed line (- - -), and C-HV in dashed-dotted line (
), C-HH in dashed line (- - -), and C-HV in dashed-dotted line ( ![]() ).
).
As a quantitative measure of separability among regeneration stage classes the Bhattacharyya distance (Fukunaga, 1972) was calculated between consecutive classes for every image, using global means and mean variances.
The results are presented in Table 3, where d(i,j) denotes this distance between class i and its consecutive class j.
From this table, reminding that the higher the distance between two classes the more separable they are, it can be concluded that the band that allows the better overall separability is L-HV, followed by C-HV, C-HH and L-HH.
It is important to notice, though, that C bands have their total Bhattacharyya distances highly increased by ![]() , while the separability amongst the regeneration classes (namely
, while the separability amongst the regeneration classes (namely ![]() ) is poor when compared to the one attainable using L bands.
) is poor when compared to the one attainable using L bands.

Table 3: BHATTACHARYYA DISTANCES BETWEEN ADJACENT REGENERATION STAGE CLASSES USING GLOBAL MEANS AND MEAN VARIANCES
It is also clear that, since d((4,6], (6,8]) is small for every band, it will be very hard to discern these two regeneration stage classes using this kind of SAR data. This apparent saturation of the return might be caused by --among other factors-- the way the vegetation structure evolves with time. Early stages of secondary succession are characterized by a very dense undergrowth with weedy herbaceous plants and fast growing vines. After a few years, the combination of vines and woody pioneer species forms a nearly closed canopy (Ewel, 1977). With the passing of time the canopy becomes rougher with pioneer species standing above vines and the understory looses in number of individuals because of competition for light and soil nutrients, causing then the return from this part to be reduced.
When instead of mean variances the estimated variances of the data are used the total Bhattacharyya distances are 0.10 (L-HH), 0.20 (L-HV), 0.04 (C-HH) and 0.04 (C-HV), indicating that discrimination through tonal means is possible only when large areas are used.
The variation between the global mean values of primary forest and recent activities areas is of the order of 5 dB for L-HV and of 2 dB for L-HH, while at C-band the variation is less than 0.5 dB.