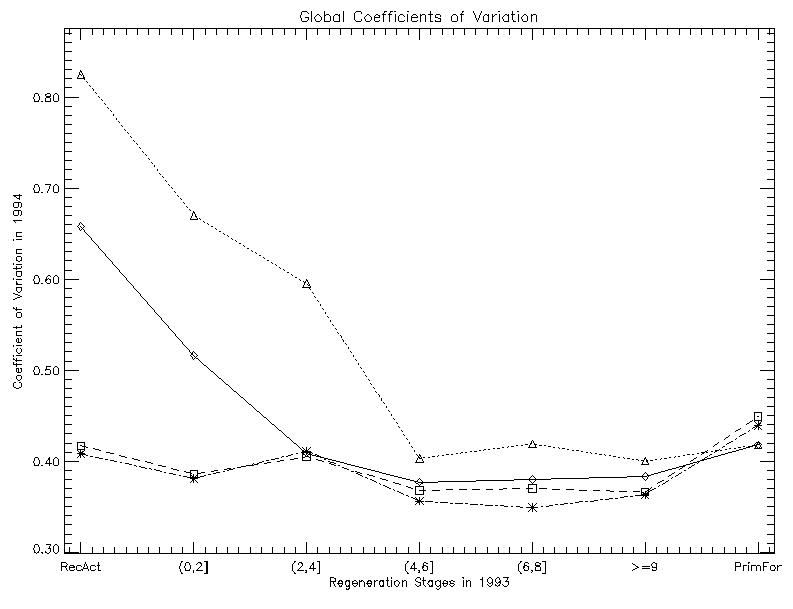
Figure 8 (a) to (d) shows the individual CV for each image region of each class (diamonds). The lines join the CV of each class taken as a whole (global CV). There is a large variation of CV between individual image regions similar to that observed in the response of the means. The reasons for these large variations between image regions of the same class are probably the same as for the mean values. The CV will be especially sensitive to man-made structures such as roads as these represent a high textural variation. Figure 9 shows the global CV of the four combinations of wavelength and polarization.

Figure 8: Coefficients of variation per class (continuous lines) and per individual image region ( ![]() ): (a) L-HH, (b) L-HV, (c) C-HH and (d) C-HV.
): (a) L-HH, (b) L-HV, (c) C-HH and (d) C-HV.

Figure 9: Global coefficient of variation per class: solid line
(--) L-HH, dotted line ( ![]() ) L-HV, dashed line (- - -) C-HH, and dashed-dotted line (
) L-HV, dashed line (- - -) C-HH, and dashed-dotted line ( ![]() ) C-HV
) C-HV
In these plots a downwards trend can be observed for L-band up to the ``(4,6]'' regeneration stage. After this stage the response varies little up to the `` ![]() '' class.
The C-band has approximately the same behaviour in both polarizations, being almost flat up to the ``
'' class.
The C-band has approximately the same behaviour in both polarizations, being almost flat up to the `` ![]() '' class and with a peak at the ``(2,4]'' regeneration stage.
This can be explained by the large variation of the corresponding means shown in Figure 6 (c) and (d).
'' class and with a peak at the ``(2,4]'' regeneration stage.
This can be explained by the large variation of the corresponding means shown in Figure 6 (c) and (d).
There is an increase of the CV between old secondary forest (`` ![]() '') and primary forest. This increase is more noticeable for the C-band images.
This increase may be explained by the appearance of emergent trees in the forest canopy which will cast radar shadows and increase the image texture.
The largest differences between CVs is exhibited by L-HV band.
'') and primary forest. This increase is more noticeable for the C-band images.
This increase may be explained by the appearance of emergent trees in the forest canopy which will cast radar shadows and increase the image texture.
The largest differences between CVs is exhibited by L-HV band.
The discriminatory properties of the CV for large samples suggest the use of any polarization of the L-band, whenever separating among Recent Activities,``(0,2]'', ``(2,4]'' and ``(4,6]'' classes. No discrimination seems possible among the ``(4,6]'', ``(6,8]'' and `` ![]() '' classes with any of the considered frequencies.
'' classes with any of the considered frequencies.
The quantitative assessment of the discriminatory capabilities of CV was made through the Euclidean distance between consecutive regeneration stage classes, and the results are shown in Table 4 using the same notation of Table 3. Since there is no measurable variance for the CV of a region, it was not possible to use other distances (such as the Bhattacharyya distance or the divergence) that take a measure of dispersion into account. For this same reason no confidence intervals were drawn in Figure 9. From Table 4 it can be concluded that the best overall separability is achieved using the L-HV data, followed by L-HH, C-HH and C-HV bands and polarizations. It is also clear that the CV of the L-band images allows a better discrimination among recent activities and early stages regeneration than the same measure over C-band, and that discrimination among consecutive stages of regeneration after ``(4,6]'' class seems similar for any of the considered bands and polarizations.

Table 4: EUCLIDEAN DISTANCES BETWEEN ADJACENT REGENERATION STAGE CLASSES USING COEFFICIENTS OF VARIATION
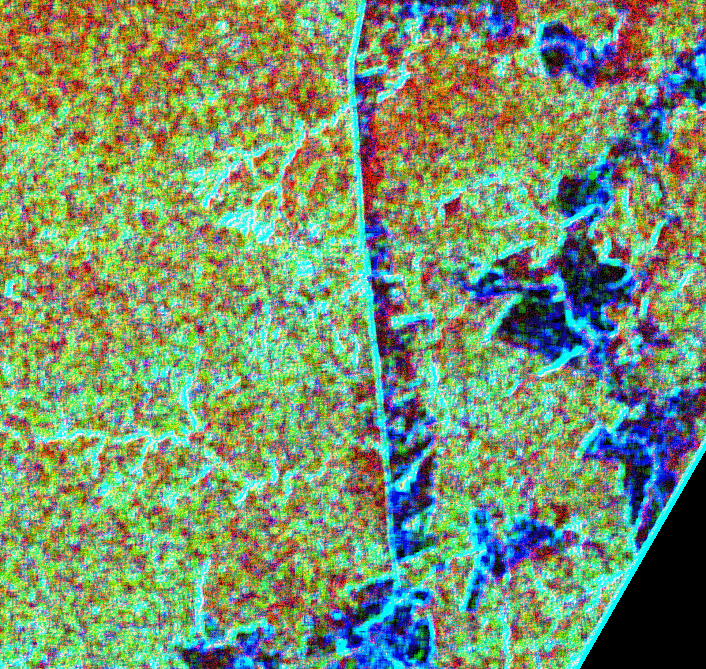
A filter of CV was applied to each SIR-C SAR image using a ![]() square window, and a color composition was formed with the L-HV original image in the Red channel, the mean of the two CV-filtered C images in the Green channel, and the mean of the two CV-filtered L images in the Blue channel.
This color composite is shown in Figure 10.
This image evidences areas of old regeneration, as the one shown by the arrow in the figure.
This area can be barely seen in any color composite of the original SIR-C SAR images (as, for example, in Figure 2).
This fact shows the importance of the CV for discriminating areas of old regeneration.
square window, and a color composition was formed with the L-HV original image in the Red channel, the mean of the two CV-filtered C images in the Green channel, and the mean of the two CV-filtered L images in the Blue channel.
This color composite is shown in Figure 10.
This image evidences areas of old regeneration, as the one shown by the arrow in the figure.
This area can be barely seen in any color composite of the original SIR-C SAR images (as, for example, in Figure 2).
This fact shows the importance of the CV for discriminating areas of old regeneration.

bf Figure 10: Color composition using CV-filtered images (L-HV original image (R), mean of the two CV-filtered C images (G), mean of the two CV-filtered L images (B)).
From the analysis of Figures 6 and 7 it may be concluded that a classification using only the CV values would probably be poorer than the one achievable through the use of mean values.
In Yanasse et al (1993) the study of SAREX data (C-HH and C-VV images) led to different conclusions. In that work it is shown that the mean value is not capable of separating forest from non-forest areas, while the CV appeared a very attractive measure for that purpose. Among the reasons for this different behaviour are the different resolution, angle of incidence and number of looks, not to mention that the SAREX images were not registered, while the SIR-C SAR data were. It is known that the registration process --that involves the resampling and convolution of the pixel values-- may have a influence on the statistical properties of image data (Yanasse et al, 1994).